Solar Collector Efficiency Curves
The efficiency of a solar collector is rated based on two inputs. The first is the amount of solar irradiation. This is the measurement of the amount of radiation falling on the surface of the earth and is rated in Watts/M2. The theoretical maximum is 1000 Watts/M2, however in certain cases we can exceed this such as is the case when we have both direct sunlight and reflective sunlight.
The second variable is known as the “Delta T”. This is the difference between the water temperature inside the collector and the air temperature outside the collector. As the water temperature gets hotter this difference gets greater, or similarly as the outdoor temperature gets colder this variable also gets greater.
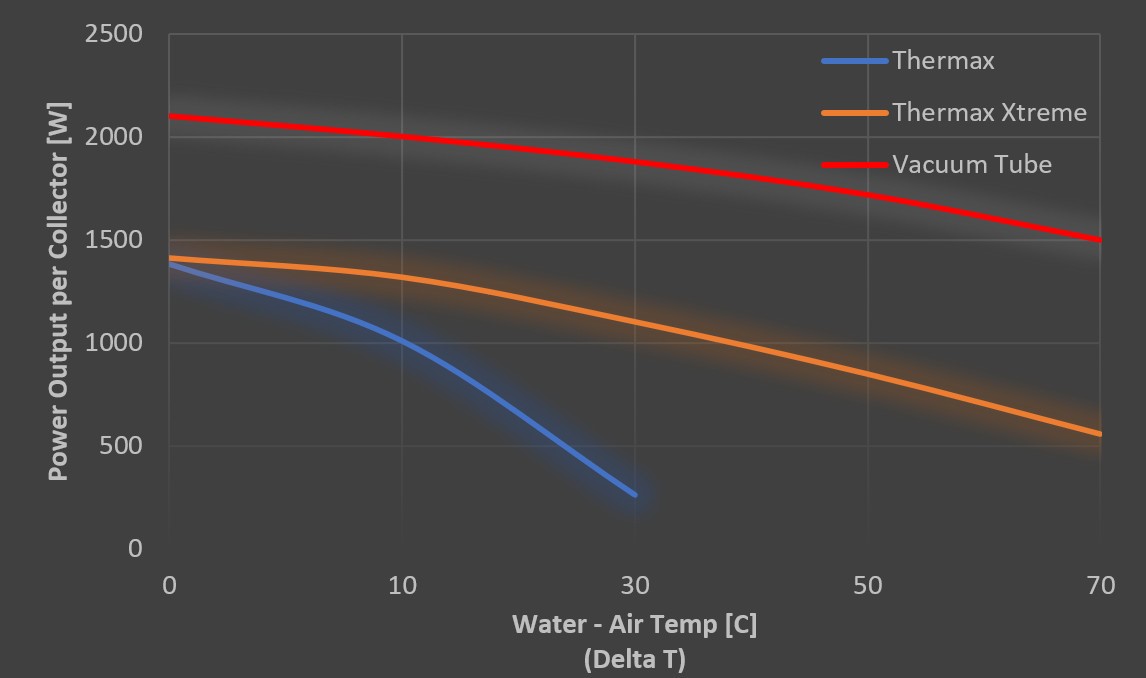
When we combine these two on a graph, we get the output (Power) of the collector at various Delta Tees. In the graph below this is based on assumption of 1000 W/M2. However, most of the time the sunlight is significantly less than this theoretical Max.
Power Per Collector Type
Based on 1000 Watt/M2
Based on the construction of the type of collector we can see that the collectors lose their ability to produce energy the greater the delta. This is called a declining efficiency curve. The flatter the curve, the better they can produce energy in colder weather or at hotter conditions.
Pool Heating
One might conclude that Vacuum Tubes have the best efficiencies and solar pool collectors have the worst. However, pool temperatures are typically targeted at 24-30 C (74 -86 F). If the outdoor temperature is 22 and we are tying to get 32 degree of supply pool water, then our actual delta is 10. Looking at the power graph at a Delta T of 10 C.
Thermax = 1000 watts
Thermax Extreme =1300 watts
Vacuum Tubes = 2000 watts (WINNER)
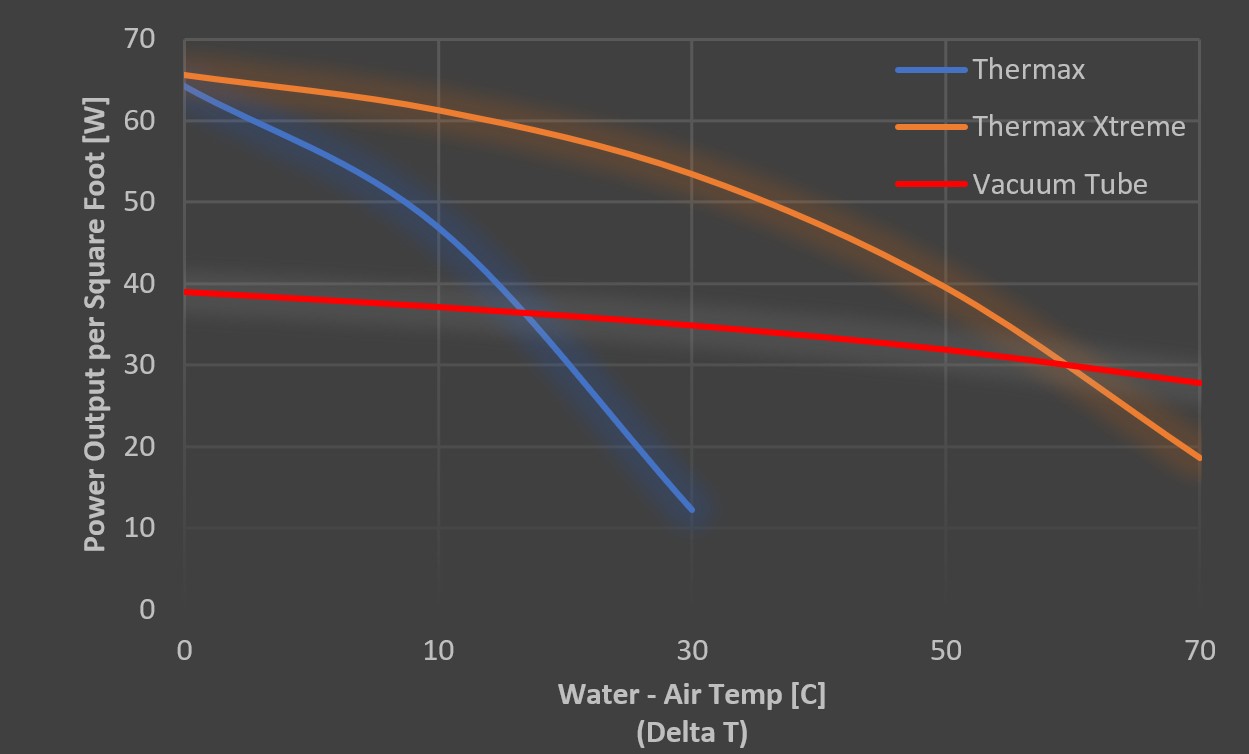
However, to draw a proper comparison we can see that the dimension of the vacuum tube are 2 meters x 2.5 meters or 5 m2 (53.8 ft2), so given the amount of roof space that one Thermax pool collector takes up is only 2 M2 (21.5 ft2), we have a different result when based on power per square foot.
Thermax =1000/21.5= 46.5 Watts/ft2
Thermax Extreme = 1300/21.5 = 60.5 Watts/ft2 (WINNER)
Vacuum Tubes = 2000/53.8 = 37.2 Watts/ft2
Power Per Square Foot
Based on 1000 Watt/M2
Space Heating
This story will change if we are looking at heating a house in -20 C (-4 F) and need to produce 50 C (122F) water to heat the home. Now we have a delta of 70 C. At this design temperature the vacuum tubes can produce 1500 Watts whereby the Thermax simply don’t work and the flat plate Thermax Extreme produce about 500 Watts. Based again on square footage the Winner here is clearly the vacuum tubes.
Vacuum Tube = 27.8 watts/ft2 (Winner)
Thermax = 0 Watts/ft2
Thermax Extreme = 18.6 Watts/ft2


